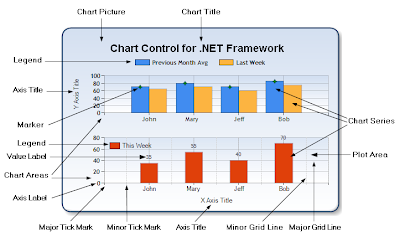
This code shows you how to display information from a dataset in a chart using the MSChart control. A number of features of this control are illustrated.
System Setup:
Download the following component for MS Chart Control and install in your PC
1.Visual Studio 2008 Professional Edition (90-day Trial)
(http://www.microsoft.com/downloads/details.aspx?familyid=83C3A1EC-ED72-4A79-8961-25635DB0192B&displaylang=en)
2.Microsoft Visual Studio 2008 Service Pack 1
(http://www.microsoft.com/downloads/details.aspx?familyid=FBEE1648-7106-44A7-9649-6D9F6D58056E&displaylang=en)
3.Microsoft Chart Controls for Microsoft .NET Framework 3.5
(http://www.microsoft.com/downloads/details.aspx?FamilyID=130f7986-bf49-4fe5-9ca8-910ae6ea442c&displaylang=en)
4.Microsoft Chart Controls Add-on for Microsoft Visual Studio 2008
(http://www.microsoft.com/downloads/details.aspx?familyid=1D69CE13-E1E5-4315-825C-F14D33A303E9&displaylang=en)
Steps to create chart
Step 1:Create a website -
Create a new website in Visual studio 2008(File->New Website),choose the language C# and write the file name "testWebSite)

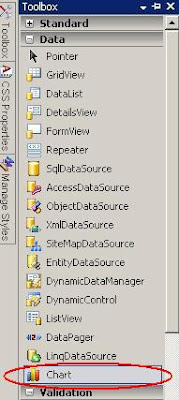
Step 2:Add Chart item to the toolbox -
Open the toolbox ,Right click any tab(Here,I have choosen the Data tab), click on Choose Items

Browse the folder to your installation directory.By default it will install in C drive(OS installation drive).Go to C:\Program Files->Microsoft chart controls->Assemblies

Select "System.Web.DataVisualization.dll"

Select the checkbox against "Chart"

Check the web.config file that System.Web.DataVisualization.Design,System.Web.DataVisualization,System.Windows.Forms.DataVisualization.Design,System.Windows.Forms.DataVisualization comes under assemblies tag
<compilation debug="true">
<assemblies>
<add assembly="System.Core, Version=3.5.0.0, Culture=neutral, PublicKeyToken=B77A5C561934E089"/>
<add assembly="System.Web.Extensions, Version=3.5.0.0, Culture=neutral, PublicKeyToken=31BF3856AD364E35"/>
<add assembly="System.Data.DataSetExtensions, Version=3.5.0.0, Culture=neutral, PublicKeyToken=B77A5C561934E089"/>
<add assembly="System.Xml.Linq, Version=3.5.0.0, Culture=neutral, PublicKeyToken=B77A5C561934E089"/>
<add assembly="System.Web.DataVisualization.Design, Version=3.5.0.0, Culture=neutral, PublicKeyToken=31BF3856AD364E35"/>
<add assembly="System.Web.DataVisualization, Version=3.5.0.0, Culture=neutral, PublicKeyToken=31BF3856AD364E35"/>
<add assembly="System.Windows.Forms.DataVisualization.Design, Version=3.5.0.0, Culture=neutral, PublicKeyToken=31BF3856AD364E35"/>
<add assembly="System.Windows.Forms.DataVisualization, Version=3.5.0.0, Culture=neutral, PublicKeyToken=31BF3856AD364E35"/></assemblies>
</compilation>
And will come under the toolbox

Step 3:Design a chart in ASPX page
Now you can write the following code in your ASPX page or drag the chart control from toolbox to your aspx page.
<asp:Chart ImageType="Png" ID="Chart1" runat="server"
BackColor="#D3DFF0" Palette="BrightPastel" Width="412px" Height="296px" borderlinestyle="Solid" backgradientendcolor="White" backgradienttype="TopBottom"
BorderlineWidth="2" BorderlineColor="26, 59, 105"
OnClick="Chart1_Click">
<Titles>
<asp:Title ShadowColor="32, 0, 0, 0" Font="Trebuchet MS, 14.25pt, style=Bold" ShadowOffset="3"
Text="Demo Chart" Alignment="TopLeft" ForeColor="26, 59, 105">
</asp:Title>
</Titles>
<Series>
<asp:Series Name="Series1" XAxisType="Primary" XValueMember="Name" XValueType="Double"
YValueMembers="TotalCost" YValueType="Double" BorderColor="Brown" Color="SeaGreen"
ShadowColor="Yellow" ShadowOffset="1" ChartType="Column" YValuesPerPoint="4">
</asp:Series>
<asp:Series Name="Series2" XAxisType="Primary" XValueMember="Name2" XValueType="Double"
YValueMembers="TotalCost2" YValueType="Double" BorderColor="Brown" Color="Aqua"
ShadowColor="Yellow" ShadowOffset="1" ChartType="Line" YValuesPerPoint="4">
</asp:Series>
</Series>
<ChartAreas>
<asp:ChartArea Name="ChartArea1" BorderColor="Red">
</asp:ChartArea>
</ChartAreas>
<Legends>
<asp:Legend Enabled="true" Name="Default" LegendStyle="Table" BackColor="Transparent" Font="Trebuchet MS, 8.25pt, style=Bold">
<Position Y="90" Height="12" Width="18" X="0"></Position>
</asp:Legend>
</Legends>
<BorderSkin SkinStyle="Sunken"></BorderSkin>
</asp:Chart>
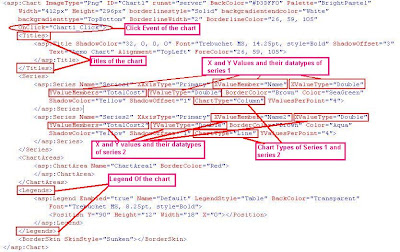
In this code,
<Titles> </Titles> defines the chart title.
<Series> </Series> defines the different type of series like line,pie,bar etc.A single chart contain multiple series .In our example I have taken two series: Series1 and Series2
Series1 is a column series which is defiend in the ChartType properties of that series.and the series2 is a line series mentioned in the charttype
In the series XValueMember and XValueType define which column of dataset it will bind with X Axis and the datatype of that column.
Similarly YValueMembers and YValueType define the member and data type of Y Axis.
In our example XValueMember,XValueType,YValueMembers,YValueType series1 are Name,Double,TotalCost and Double respectively.
and XValueMember,XValueType,YValueMembers,YValueType series2 are Name2,Double,TotalCost2 and Double respectively.
Legend properties of the chart defines the legend of the chart.
The chart has a different event that can be handled from the Server Side code.I have choose OnClick event(OnClick="Chart1_Click")
Rest of the properties are mostly define the appearance of the chart.

More Detail View

Take a asp:Label to display the chart event output.Put "lblValue" in the lable ID.
<asp:Label ID="lblValue" runat="server"<</asp:Label>
Step 4:Create dataset to bind the chart from server side:
Write the following code to create a dataset which will bind with the chart and the code to handle the click event.
We are passing the X axis values by #AXISLABEL,Y axis values by #VAL{C},series name by #SERIESNAME and the index of the chart by #INDEX to the click event
using System;
using System.Collections.Generic;
using System.Linq;
using System.Web;
using System.Web.UI;
using System.Web.UI.WebControls;
using System.Data;
public partial class _Default : System.Web.UI.Page
{
protected void Page_Load(object sender, EventArgs e)
{
this.Chart1.Series[0].PostBackValue = "<B>X :</B> #AXISLABEL;<B>Y :</B>#VAL{C};<B>Series Name :</B>#SERIESNAME;<B>Chart Index :</B>#INDEX";
this.Chart1.Series[0].ToolTip = "#AXISLABEL Name: #VAL{C}";
this.Chart1.Series[1].PostBackValue = "<B>X :</B> #AXISLABEL;<B>Y :</B>#VAL{C};<B>Series Name :</B>#SERIESNAME;<B>Chart Index :</B>#INDEX";
this.Chart1.Series[1].ToolTip = "#AXISLABEL Name: #VAL{C}";
//create a chart
DataSet ds = new DataSet();
DataTable objDataTable = new DataTable("PatientList");
DataSet objDataSet = new DataSet();
DataRow objDR;
objDataSet.Tables.Add(objDataTable);
objDataTable.Columns.Add("TotalCost", typeof(string));
objDataTable.Columns.Add("Name", typeof(string));
objDataTable.Columns.Add("TotalCost2", typeof(string));
objDataTable.Columns.Add("Name2", typeof(string));
objDR = objDataTable.NewRow();
objDR["Name"] = "10";
objDR["TotalCost"] ="11";
objDR["Name2"] = "5";
objDR["TotalCost2"] = "16";
objDataTable.Rows.Add(objDR);
objDR = objDataTable.NewRow();
objDR["Name"] = "11";
objDR["TotalCost"] = "12";
objDR["Name2"] = "18";
objDR["TotalCost2"] = "10";
objDataTable.Rows.Add(objDR);
objDR = objDataTable.NewRow();
objDR["Name"] = "12";
objDR["TotalCost"] = "15";
objDR["Name2"] = "15";
objDR["TotalCost2"] = "19";
objDataTable.Rows.Add(objDR);
objDR = objDataTable.NewRow();
objDR["Name"] = "13";
objDR["TotalCost"] = "18";
objDR["Name2"] = "11";
objDR["TotalCost2"] = "15";
objDataTable.Rows.Add(objDR);
Chart1.DataSource = objDataSet;
Chart1.DataBind();
}
protected void Chart1_Click(object sender, ImageMapEventArgs e)
{
lblValue.Text = String.Format("{0}", e.PostBackValue);
}
}
Step 5.Run your application by pressing F5 ,you can see the following output

Click on series of the chart,you can see that the label is changing with the data of that particular series.

I have tried a simple way of binding the chart with dataset.You can bind the chart with database table with the same way.You also can change the chart on the click event or navigate to a new page with the data of the click point.


4 comments:
very informative article
Thank you very much.It will inspire me.
if u have tried in windows form application pls post it !!
i.e : component click event
Chart databinding in .NET
Post a Comment